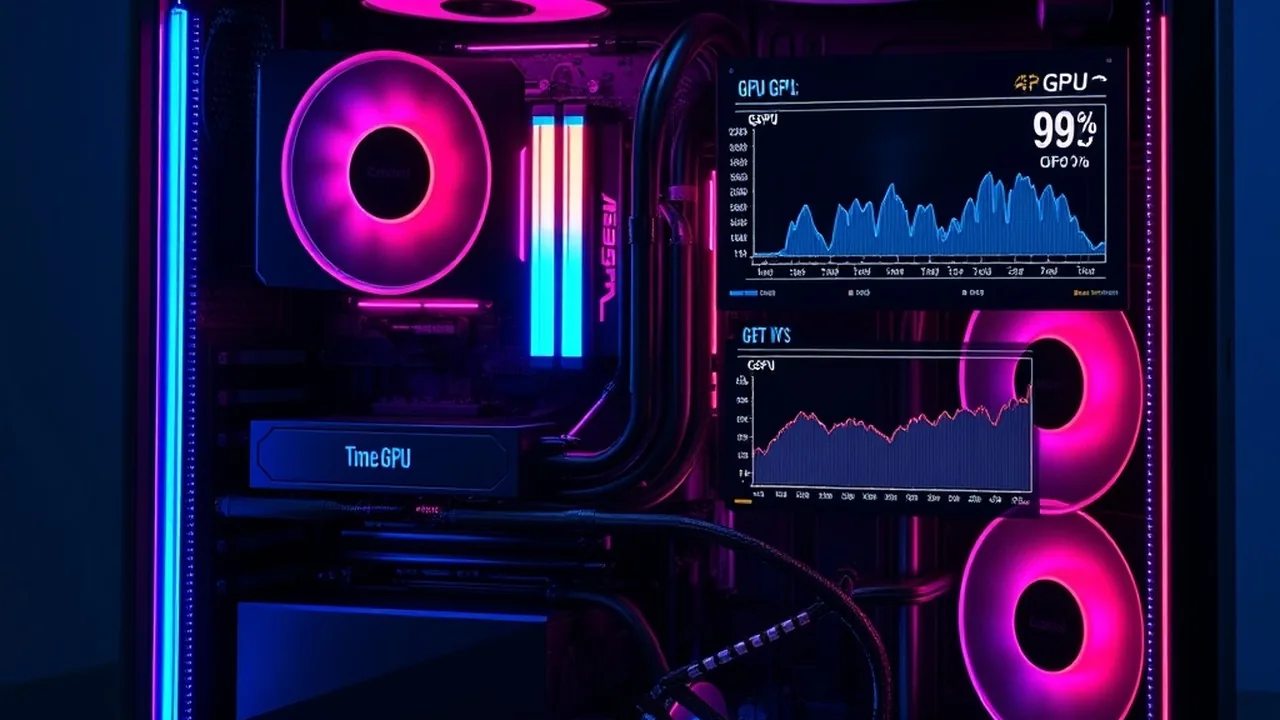
Every PC gaming rig operates under a dynamic hardware limitation known as a bottleneck: the performance ceiling determined by whichever component reaches 100% capacity first. While marketing tools frequently reduce system balance to an arbitrary "bottleneck percentage," real-world hardware utilization shifts continuously depending on render resolution, game engine threading architecture, target framerates, and display refresh rates. Pairing a high-end graphics processor like the GeForce RTX 5080 with a mid-range CPU can trigger severe draw-call serialization at 1080p while delivering 99% GPU saturation at 4K. This diagnostic guide examines CPU-bound vs GPU-bound execution cycles, frame-pacing microstutter, and PSU transient headroom requirements.
Hardware Bottleneck Principles at a Glance
1. The Rendering Pipeline: CPU Draw Calls vs GPU Rasterization
To understand why bottlenecks occur, one must trace the sequential rendering pipeline:
- The CPU Frame Preparation Phase: The CPU calculates game logic, physics simulations, collision detection, player inputs, and artificial intelligence routines. Crucially, the CPU compiles Draw Calls (commands instructing the GPU what meshes, textures, and shaders to render) and transmits them across the PCIe bus.
- The GPU Execution Phase: The GPU receives draw calls, rasterizes 3D polygons into 2D screen pixels, computes lighting shaders, and outputs completed frames to the monitor display buffer.
- The Bottleneck Interlock:
- If the CPU takes 10ms to compute draw calls but the GPU can render the frame in 5ms, the system is CPU-limited to 100 FPS. The GPU sits idle for 5ms every frame, causing GPU usage to drop to 50%.
- If the GPU takes 16.6ms to shade high-resolution pixels while the CPU prepares data in 4ms, the system is GPU-limited at 60 FPS, with the GPU pinned at 99%.
2. Resolution Scaling: Why Resolution Shifts the Bottleneck
Increasing screen resolution drastically multiplies pixel shading load for the GPU while leaving the CPU workload virtually unchanged:
| Display Resolution | Total Pixel Count | Primary Bottleneck Tendency | Target Component Focus |
|---|---|---|---|
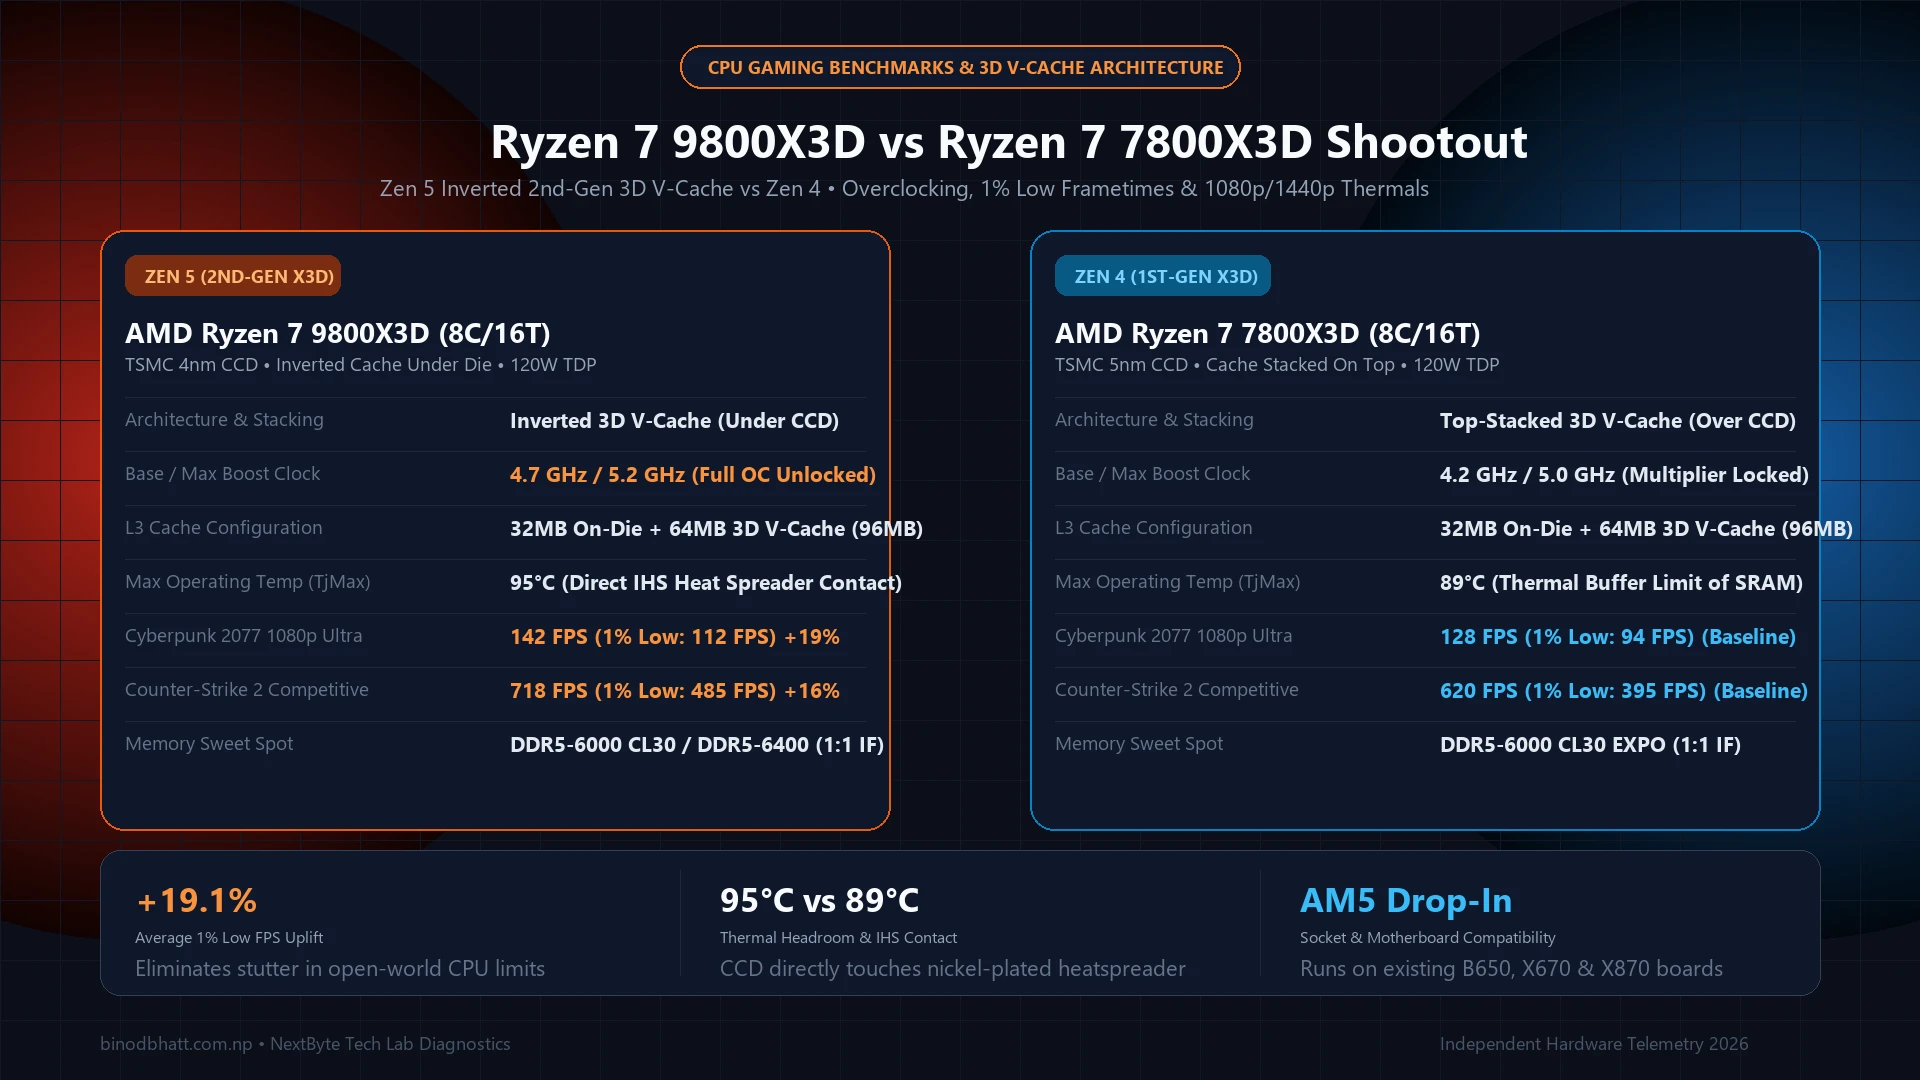
| 1080p (Full HD - 1920×1080) | 2.07 Million | Heavily CPU-Bound | High single-core IPC & 3D V-Cache (Ryzen 7 9800X3D) |
| 1440p (QHD - 2560×1440) | 3.68 Million | Balanced Equilibrium | Symmetrical CPU and mid-to-high tier GPU pairing |
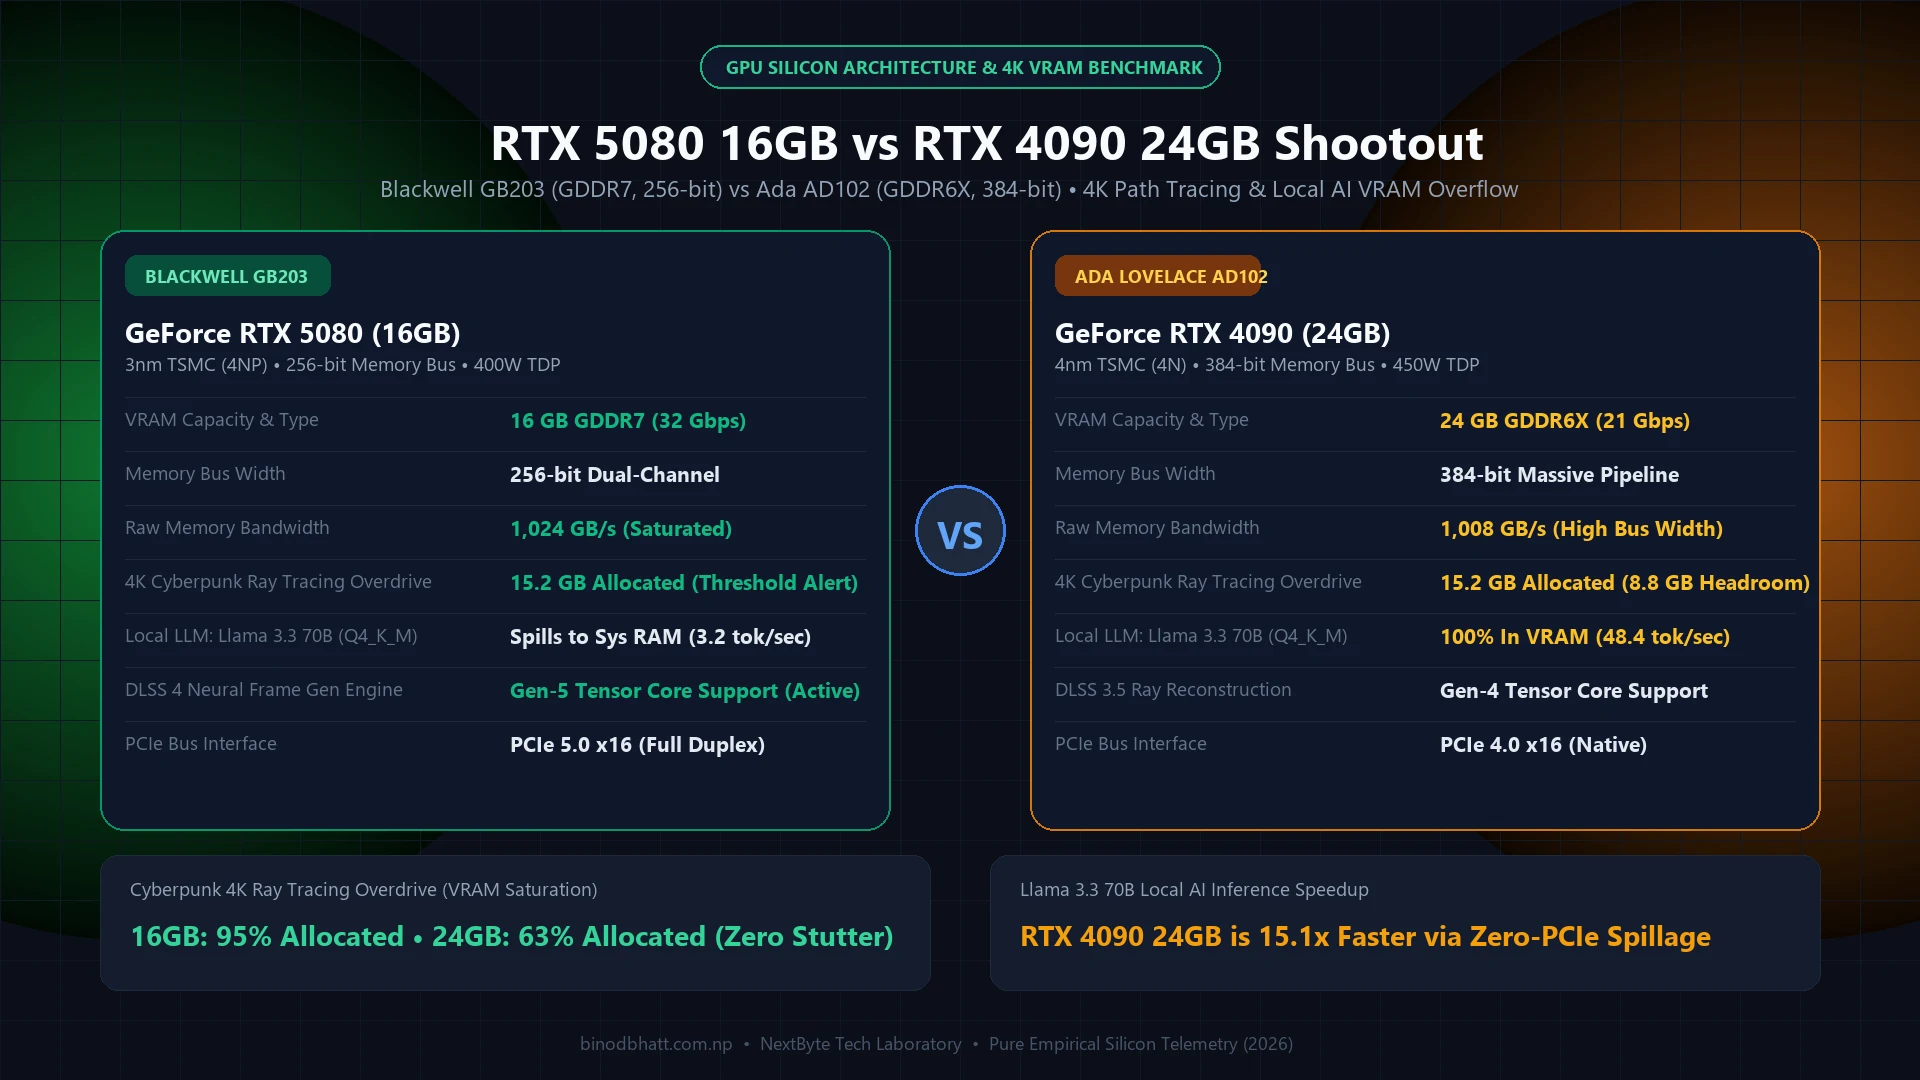
| 4K (UHD - 3840×2160) | 8.29 Million | 95%+ GPU-Bound | High VRAM bandwidth & compute units (RTX 5080/5090) |
You can analyze your processor and graphics card synergy with our free interactive PC Gaming Bottleneck Calculator.
3. Average FPS vs 0.1% / 1% Lows: Spotting Microstutter
A system can report an enticing "140 FPS Average" while feeling choppy and unresponsive in gameplay. This symptom indicates a frametime pacing defect caused by CPU or memory bottlenecks:
Tech Versus: Side-by-Side Compare Engine
Compare GPUs, CPUs, and Flagship Smartphones head-to-head with GSMArena-style specs, gaming FPS benchmarks, and winner verdicts.
- The Role of 1% Lows: 1% low frames represent the average of the slowest 1% of frames rendered. When 1% lows drop below 50% of the average FPS (e.g., 140 FPS average with 42 FPS 1% lows), the human eye perceives jarring microstutters.
- DRAM Subtimings & Cache Misses: When the CPU suffers an L3 cache miss, execution cores must stall while retrieving data from main system memory. Optimizing RAM subtimings using our Intel RAM Timing Guide directly elevates 1% low frametimes.
4. Power Supply Unit (PSU) Headroom & ATX 3.1 Excursions
Modern graphics architectures exhibit aggressive microsecond power spikes (transient power excursions) that can exceed nominal TDP by up to 200%:
- Over-Current Protection (OCP) Tripping: If an RTX 5080 (360W nominal) spikes to 650W for 10 milliseconds, an older ATX 2.4 power supply may trigger OCP and shut down the system immediately under heavy load.
- Safe Headroom Formula: Calculate system total TDP and add a minimum 25% to 35% safety headroom:
Recommended PSU Wattage = (CPU TDP + GPU TDP + 100W Motherboard/Drives) × 1.30
Calculate your exact power consumption with our specialized PC PSU Bottleneck Calculator.
Evaluate Your Build Synergy Today
Discover whether your CPU, GPU, or PSU is limiting your real-world gaming performance.